
We are pleased to announce a FREE online training in Cognos Query Studio.Query studio is a Cognos tool that can whip up adhoc reports and analysis for users by users.
Introduction to Query Studio
Examine Query Studio and its interface
Add and save data to ad hoc reports
View data by using appropriate charts
Create list, grouped list, and crosstab reports
Filter and sort your reports
Create detail and summary calculations
Move columns and reorder columns
New features in Cognos8.4 Query Studio
Best Practices and optimization of queries
Please mark your calendars for August 21st 2009 between 10:00-11:00 AM. Please email support@softpath.net to confirm your seat and receive a copy of the training documentation.
Thursday, July 23, 2009
Wednesday, July 15, 2009
Pointers while Integrating/migrating- M&A scenario
Here are some general pointers to be kept in mind, while planning migrations, upgrades, conversions and the likes. Most of these recommendations can be made only after a thorough understanding of client systems architecture, maturity of their BI systems and their future plans. Anyways here is an appetizer.
1. Assess your architecture
2. Huge performance gains can be achieved by having dedicated servers for reporting services, batch report services, Agent and monitoring services and presentation services respectively.
3. Gateways
ISAPI is most recommended gateway. Also improve performance by adding multiple gateways.
Especially, if you have multiple locations for your servers
4. Perform Capacity Planning Exercise. Most BI tools offer pre built exercises.
5. If switching Security namespaces, you will encounter a lot of accessibility issues and will not be able to export personal content
6. If you have external vendors/clients accessing your BI portal the firewalls can cause accessibility issues. You will have to configure your firewalls and gateways to support multiple dispatchers.
7. Consider virtualization of your servers to cut costs
8. If in the near future, you plan on merging data sources multiple companies, you might have to plan back up of existing Models, packages and data source connections. Also, perform a step by step deployment into new environments or domains.
Some Challenges you might come across are:
1. Accessing cross company portals. Are you going to have 2 portals? Are you going to add users in two domains?
2. If development and support teams are in Domain A and have to support users in domain B. Developers and support Team, ticket management has to work across domains with additional privileges. This might not seem like huge liability but it can be time consuming to get it up and running
3. There will be a need for more licenses and appropriate capabilities
4. You will have to assess he hardware requirements and configuration
However, this is a very good time and opportunity to introduce new BI technologies and practices.
- You could start a BICC ( BI Competency Center)
- Upgrade to newer versions of the tools
1. Assess your architecture
2. Huge performance gains can be achieved by having dedicated servers for reporting services, batch report services, Agent and monitoring services and presentation services respectively.
3. Gateways
ISAPI is most recommended gateway. Also improve performance by adding multiple gateways.
Especially, if you have multiple locations for your servers
4. Perform Capacity Planning Exercise. Most BI tools offer pre built exercises.
5. If switching Security namespaces, you will encounter a lot of accessibility issues and will not be able to export personal content
6. If you have external vendors/clients accessing your BI portal the firewalls can cause accessibility issues. You will have to configure your firewalls and gateways to support multiple dispatchers.
7. Consider virtualization of your servers to cut costs
8. If in the near future, you plan on merging data sources multiple companies, you might have to plan back up of existing Models, packages and data source connections. Also, perform a step by step deployment into new environments or domains.
Some Challenges you might come across are:
1. Accessing cross company portals. Are you going to have 2 portals? Are you going to add users in two domains?
2. If development and support teams are in Domain A and have to support users in domain B. Developers and support Team, ticket management has to work across domains with additional privileges. This might not seem like huge liability but it can be time consuming to get it up and running
3. There will be a need for more licenses and appropriate capabilities
4. You will have to assess he hardware requirements and configuration
However, this is a very good time and opportunity to introduce new BI technologies and practices.
- You could start a BICC ( BI Competency Center)
- Upgrade to newer versions of the tools

Tuesday, June 16, 2009
Master Data Management
Authored by:Chintan
What is Master Data? Most of the IT organizations have their data dispersed and stored at various locations. But the data is shared and used by several of the applications that make up a data warehouse. For example, an ERP system has data from Customer Master, Item Master and Account Master. The master data is one of the key assets of any company.
Need of Master Data Management: Since master data is used by multiple applications, an error in master data can cause errors in all the applications that use it. For example, all important documents, bills, checks are sent to the wrong person because of an incorrect address in Customer Master. Similarly, an incorrect price in Item Master can be a marketing disaster for an organization. An incorrect account number in an Account Master can lead to huge fines. To overcome such hazards, maintaining high quality and consistent set of master data is necessary for all organizations.
What is Master Data Management (MDM)? The technology, tools and processes required to create and maintain consistent and accurate lists of master data is known as Master Data Management. MDM is a continuous, iterative process. There are many factors considered for MDM which involves requirements, priorities, resource availability, time frame and the size of the problem.
MDM Life Cycle: MDM project involves many stages as follows:
1- Identify sources of master data.
2- Identify the producers and consumers of the master data.
3- Collect and analyze metadata about master data.
4- Appoint data stewards.
5- Develop the master-data model.
6- Choose a toolset.
7- Finalize and receive approval for the process.
8- Design and implement the process.
9- Test the master data.
10- Modify the producing and consuming systems.
11- Implement the maintenance processes.
Conclusion: In recent times, creating and maintaining accurate and complete master data has become a business imperative. Both large and small businesses must develop data maintenance and governance processes and procedures, to obtain and maintain accurate master data.
What is Master Data? Most of the IT organizations have their data dispersed and stored at various locations. But the data is shared and used by several of the applications that make up a data warehouse. For example, an ERP system has data from Customer Master, Item Master and Account Master. The master data is one of the key assets of any company.
Need of Master Data Management: Since master data is used by multiple applications, an error in master data can cause errors in all the applications that use it. For example, all important documents, bills, checks are sent to the wrong person because of an incorrect address in Customer Master. Similarly, an incorrect price in Item Master can be a marketing disaster for an organization. An incorrect account number in an Account Master can lead to huge fines. To overcome such hazards, maintaining high quality and consistent set of master data is necessary for all organizations.
What is Master Data Management (MDM)? The technology, tools and processes required to create and maintain consistent and accurate lists of master data is known as Master Data Management. MDM is a continuous, iterative process. There are many factors considered for MDM which involves requirements, priorities, resource availability, time frame and the size of the problem.
MDM Life Cycle: MDM project involves many stages as follows:
1- Identify sources of master data.
2- Identify the producers and consumers of the master data.
3- Collect and analyze metadata about master data.
4- Appoint data stewards.
5- Develop the master-data model.
6- Choose a toolset.
7- Finalize and receive approval for the process.
8- Design and implement the process.
9- Test the master data.
10- Modify the producing and consuming systems.
11- Implement the maintenance processes.
Conclusion: In recent times, creating and maintaining accurate and complete master data has become a business imperative. Both large and small businesses must develop data maintenance and governance processes and procedures, to obtain and maintain accurate master data.
Wednesday, June 10, 2009
Data Quality
In 2003 the Data Warehousing Institute calculated that bad data quality leads to a whopping loss of, approx $600 billion annually.
Data Quality Improvement is the processes and technologies involved in ensuring the conformance of data values to business requirements and acceptance criteria.
The reasons that adversely affect the data quality are:
Legacy Systems and data: Legacy Systems may/may not have validations in built into them. Legacy Systems tend to have redundant data, composite keys and referential integrity issues.
Application Evolution : Applications evolve over time and the data entry operations, client and server side validations are often overlooked resulting in bad data quality.
System Work-Around: More often than not, immediate results and often temporary measures are deployed to meet time deadlines or technology limitations.
Time Decay: The best of the systems cannot stand the test of the time. What better example than Y2K bug. Data quality deteriorates with time.
Lack of common data standards: Companies do not always invest time and resources into creating best practices, standards and checklists. Simple tasks such as having universal naming conventions can improve quality of the data.
Data Entry issues: Data entry issues are top1 reason for adversely affecting the quality of the data. If data entry is performed by customers or web based users, it is most likely that junk and misplaced information will be gathered. Even internal data entry operations are compromised because of the ‘remarks’ or ‘comments’ sections.
So how can this data be cleared up?
DIY: Do It Yourself by looking into databases, forms, applications etc. Of course, this is not the best choice. But is a beginner’s step that can lead you to a roadmap for data cleansing.
Invest in Data Cleansing Tools: Outsource to who can do it best. Yes, now we are talking business. Invest in identifying the suitable tools in the market. Here are some:
· Informatica Power Center
· Trillium Software
· Business Objects Data Integrator
· Data Flux
So, going forward how do you prevent rather than cure? Here are some ideas gathered by us.
Data Profiling – analyze the date for correctness, completeness, uniqueness, consistency, and reasonability. This must be done in the order of column profiling, dependency profiling, and then redundancy profiling.
Data Cleansing – Detect and correct corrupt or inaccurate records from a record set, table, or database. The common methods are parsing, data transformation, duplicate elimination, and many statistical methods.
Data Defect Prevention –Set up a data governance group that will take control and responsibility of the various databases and enforce/introduce data quality rules. They will conduct regular audits and data cleansing programs. They also have to take charge of the training of data entry and other personnel.
Data Quality: Authored by Vivek and Devi. Cleansed by Vai :-)
Data Quality Improvement is the processes and technologies involved in ensuring the conformance of data values to business requirements and acceptance criteria.
The reasons that adversely affect the data quality are:
Legacy Systems and data: Legacy Systems may/may not have validations in built into them. Legacy Systems tend to have redundant data, composite keys and referential integrity issues.
Application Evolution : Applications evolve over time and the data entry operations, client and server side validations are often overlooked resulting in bad data quality.
System Work-Around: More often than not, immediate results and often temporary measures are deployed to meet time deadlines or technology limitations.
Time Decay: The best of the systems cannot stand the test of the time. What better example than Y2K bug. Data quality deteriorates with time.
Lack of common data standards: Companies do not always invest time and resources into creating best practices, standards and checklists. Simple tasks such as having universal naming conventions can improve quality of the data.
Data Entry issues: Data entry issues are top1 reason for adversely affecting the quality of the data. If data entry is performed by customers or web based users, it is most likely that junk and misplaced information will be gathered. Even internal data entry operations are compromised because of the ‘remarks’ or ‘comments’ sections.
So how can this data be cleared up?
DIY: Do It Yourself by looking into databases, forms, applications etc. Of course, this is not the best choice. But is a beginner’s step that can lead you to a roadmap for data cleansing.
Invest in Data Cleansing Tools: Outsource to who can do it best. Yes, now we are talking business. Invest in identifying the suitable tools in the market. Here are some:
· Informatica Power Center
· Trillium Software
· Business Objects Data Integrator
· Data Flux
So, going forward how do you prevent rather than cure? Here are some ideas gathered by us.
Data Profiling – analyze the date for correctness, completeness, uniqueness, consistency, and reasonability. This must be done in the order of column profiling, dependency profiling, and then redundancy profiling.
Data Cleansing – Detect and correct corrupt or inaccurate records from a record set, table, or database. The common methods are parsing, data transformation, duplicate elimination, and many statistical methods.
Data Defect Prevention –Set up a data governance group that will take control and responsibility of the various databases and enforce/introduce data quality rules. They will conduct regular audits and data cleansing programs. They also have to take charge of the training of data entry and other personnel.
Data Quality: Authored by Vivek and Devi. Cleansed by Vai :-)
Tuesday, June 2, 2009
What's new in Cognos8.4 GO! Family
Cognos on the GO!
Go! Mobile
The newer Go! Mobile version gained location intelligence and query capabilities as well as the ability to deliver prompted, scheduled and bursted reports. The product takes advantage of GPS information with Blackberry, Symbian and similar mobile devices.
Go! Dashboards
This is an Adobe Flash-based dashboarding tool that lets users visualize information in drag-and-drop fashion. This new feature gives dashboards a slick appearance and it supports dynamic interaction. So, visualizations change as you move sliders and drill down on data.
Go! Search
The earlier version of this product was limited to searching preexisting Cognos reports. Version 8.4 delivers original query results, as well as cubes and unstructured (Word and PDF) documents and reports.
Go! Mobile
The newer Go! Mobile version gained location intelligence and query capabilities as well as the ability to deliver prompted, scheduled and bursted reports. The product takes advantage of GPS information with Blackberry, Symbian and similar mobile devices.
Go! Dashboards
This is an Adobe Flash-based dashboarding tool that lets users visualize information in drag-and-drop fashion. This new feature gives dashboards a slick appearance and it supports dynamic interaction. So, visualizations change as you move sliders and drill down on data.
Go! Search
The earlier version of this product was limited to searching preexisting Cognos reports. Version 8.4 delivers original query results, as well as cubes and unstructured (Word and PDF) documents and reports.
Monday, June 1, 2009
What's new in Cognos 8.4 Query Studio?
In QS 8.3, users could only filter on the fields in the report body.
-QS 8.4 allows filtering on any field in the package(works only with relational packages).
- QS 8.4 allows filtering using wildcards
That's for today. More tomorrow.
-QS 8.4 allows filtering on any field in the package(works only with relational packages).
- QS 8.4 allows filtering using wildcards
That's for today. More tomorrow.
Friday, May 29, 2009
What's New in Cognos8.4
Hello everyone! We got our hands and knees dirty digging into the new Cognos8.4. Here are a series of blogs on the new features in Cognos8.4. Thank you Prachi and Amar for your contribution! You have a surprise gift on the way.This blog is supported by viewers like you. (PBS???)
Cognos has introduced new chart types and images with effects and Data lineage features.
Marimekko Chart: It is 100% stacked chart in which the width of a column is proportional to the total of the column's values. The individual segment height is a percentage of the respective column total value. It is also frequently called “Market Map” and enables Strategic Analysis. Here is an example. Step Line Charts: These are just modified Line Charts, where the data points are joined using horizontal and vertical lines. Step Line combines time and trend analysis. Following is an example of step line chart:
  Microcharts: These are miniature charts that can be inserted into lists and crosstab cells.Following is the snapshot of different microcharts available.
  Generated Images: You can define and generate an enhanced background for objects in a report. The images can be enhanced with borders, fill, drop and shadow effects. You can also apply enhanced backgrounds as a class style.
Marimekko Chart: It is 100% stacked chart in which the width of a column is proportional to the total of the column's values. The individual segment height is a percentage of the respective column total value. It is also frequently called “Market Map” and enables Strategic Analysis. Here is an example.
Step Line Charts: These are just modified Line Charts, where the data points are joined using horizontal and vertical lines. Step Line combines time and trend analysis. Following is an example of step line chart: Microcharts: These are miniature charts that can be inserted into lists and crosstab cells.Following is the snapshot of different microcharts available. Generated Images: You can define and generate an enhanced background for objects in a report. The images can be enhanced with borders, fill, drop and shadow effects. You can also apply enhanced backgrounds as a class style.Data Lineage: This is feature is available across all studios. It is viewable in the report outputs (HTML only). It traces metadata of an item. Ex. View the lineage information of a model calculation.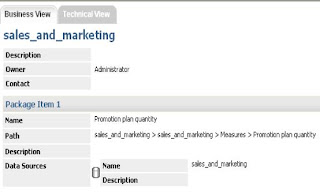
Subscribe to:
Posts (Atom)
