Cognos has introduced new chart types and images with effects and Data lineage features.
Marimekko Chart: It is 100% stacked chart in which the width of a column is proportional to the total of the column's values. The individual segment height is a percentage of the respective column total value. It is also frequently called “Market Map” and enables Strategic Analysis. Here is an example. Step Line Charts: These are just modified Line Charts, where the data points are joined using horizontal and vertical lines. Step Line combines time and trend analysis. Following is an example of step line chart:
  Microcharts: These are miniature charts that can be inserted into lists and crosstab cells.Following is the snapshot of different microcharts available.
  Generated Images: You can define and generate an enhanced background for objects in a report. The images can be enhanced with borders, fill, drop and shadow effects. You can also apply enhanced backgrounds as a class style.
Marimekko Chart: It is 100% stacked chart in which the width of a column is proportional to the total of the column's values. The individual segment height is a percentage of the respective column total value. It is also frequently called “Market Map” and enables Strategic Analysis. Here is an example.
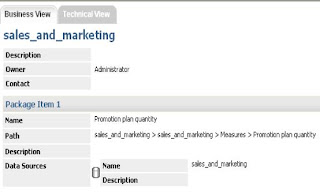
Step Line Charts: These are just modified Line Charts, where the data points are joined using horizontal and vertical lines. Step Line combines time and trend analysis. Following is an example of step line chart: Microcharts: These are miniature charts that can be inserted into lists and crosstab cells.Following is the snapshot of different microcharts available. Generated Images: You can define and generate an enhanced background for objects in a report. The images can be enhanced with borders, fill, drop and shadow effects. You can also apply enhanced backgrounds as a class style.Data Lineage: This is feature is available across all studios. It is viewable in the report outputs (HTML only). It traces metadata of an item. Ex. View the lineage information of a model calculation.