Monday, May 24, 2010

What is the difference between Analysis Studio and PowerPlay Studio?

Analysis Studio is the component of Cognos 8 that you can use for multidimensional analysis.
PowerPlay Studio lets you create and view reports that are based on multidimensional data sources.

PowerPlay Studio is a series 7 multi -dimensional tool that was re-instated in IBM Cognos8.4. PowerPlay studio is not available with Cognos 8 through Cognos8.3


Tuesday, May 11, 2010

What is the difference between DMR and PowerCubes?

DMR stands for Dimensionally Modeled Relational Data


DMR’ s are hierarchical metadata trees. They represent relational tables and columns as dimensions and hierarchies.

Reports that run against DMR packages execute against the relational tables at run time.

Powercubes also model relational data as dimensions and hierarchies. Powercubes are pre-built with summarized data.
So reports executed against Powercubes fetch data from Cube and not the database.

Reports generated against Powercubes are only as live as they were last generated.


DMR’ s and Powercubes both allow drill up and drill down functionality.


Sunday, April 4, 2010

IBM Business View Point - One version of truth

Why has Cognos not thought of a central metadata management that allows dimensions and models to be re-used across Framework Manager, PowerPlay Transformer, Planning Analyst, Cognos NOW and others?


Why can’t we create all the required dimensions with hierarchies and levels with the required attributes in one central location and deploy as need be? Well Just as I was working on this paper, Cognos 8.4 has already delivered a solution to some of my questions.

The answer is IBM Cognos 8 Business View Point.

IBM Cognos 8 Business Viewpoint Client provides you with the ability to nominate, subscribe to, and update master dimensions between IBM Cognos Planning - Analyst, IBM Cognos Planning - Contributor Administration Console, IBM Cognos TM1, IBM Cognos Transformer, and IBM Cognos Controller into Business Viewpoint Studio.

The above description provided by Cognos has 2 catches.

Catch1:

It is a Client tool, guess something like Framework Manager, so much for zero foot printing :-(. What this means is, we will need Admin privileges, Client installations and maintenance, Training and documentation, certified individuals, multiple requests to IT for providing multiple views. :-)

Catch2:

Business Viewpoint doesn’t talk about integrating Framework Manager. This takes me back to my question, why can’t we have a single, centralized metadata management that includes not just Dimensions but also tables, models, namespaces, query subjects and all.

Good news

- We can re use dimensions across multiple Cognos applications

- We can create “Views” of dimensions. This will help any business with dynamic, frequently changing dimension hierarchies. For example, HR hierarchies that constantly change, marketing managers who have to simultaneously work with multiple set of hierarchies across multiple locations

- Rework your hierarchies in MS Excel (can we live without this? ever?) and export them back to Viewpoint.

- It has in built change management, audit and version control with roll back features

If you want to watch a Business viewpoint promotional slick, click on this link.

http://download.boulder.ibm.com/ibmdl/pub/software/data/sw-library/cognos/demos/od_business_viewpoint/index.html


Monday, January 25, 2010

How to filter for a range of dates?

Typically, users create two date prompts: A Start date prompt and an End Date prompt to get data for a period.

IBM Cognos Report Studio lets you accomplish this using one Date prompt and using “in_range “ operator.
Steps:
1. Drag and Drop a Date prompt
2. Enable the Create a Parameterized filter
3. Select a date field ( such as ship date, Order date etc)
4. Select the Operator as “in-range” as shown below:


5. Click Finish and run your report

Tuesday, January 19, 2010

What does Select and Search prompt do?

IBM Cognos Report Studio provides a ‘Select & Search’ prompt. This prompt searches for a keyword and returns all matching values.

For example if you were searching for employees with the name ‘Jack’. The prompt searches and returns the values ‘Jack’, ‘Jackie’ or Jackzie’. Users can then choose the required employees and run the report.

Use a Select & Search prompt in 2 scenarios:

1. When you have too many values (too many to fit into a Value prompt)

2. When your values are case sensitive (For example, ‘Test’, ‘test’)

For example, in the image below we are searching for all employees with the name Jack


Monday, January 11, 2010

How to filter reports at different levels of data?

How do you retrieve data for last quarter in previous year and all of the current year?

Tree Prompts allow you take advantage of hierarchically structured data such as Time periods( Years, Quarters and months) and other hierarchies.
Tree Prompts displays all members in a hierarchy and allow users to select the level of detail they want to filter on.

For example, in the image below, we have a tree prompt with values selected for 1999 December and 2000 Q1.


Monday, January 4, 2010

How to standardize the numbers of rows per page on a report?

IBM Cognos Report Studio allow report authors to set the number of rows per page, the orientation of the report and default output for reports.


Steps:
1. Create a List or Crosstab report
2. Go to “Run” menu and select “Run Options”
3. Select the required report format, orientation, output and the numbers of rows per page.


Monday, December 28, 2009

Why do you see date/year or customer number or invoice number fields with values like 2016, 2032, 8022?

The reason is aggregate property was set incorrectly by the modeler. The modeler set the aggregate property to ‘Total’.

The aggregation for Attributes should be set as None, unsupported or maybe count.
Summarization should be performed only on Facts and not on attributes.
You as a report developer can set the aggregate property to ‘None’.


Monday, December 21, 2009

How to quickly display your Measures either as Values or percent of values?

IBM Cognos PowerPlay Studio allows you to display your measures as Values or percent of totals or percent of sub totals.


Steps to do this:

1. On the report Right-Click on the intersection of row and column labels

2. Choose either Values or percent of totals options.


Tuesday, December 15, 2009

How to display your reports on the Dashboard?

IBM Cognos Report studio allows you to display selected reports on your Dashboard.
Steps to do this:
1. Click on new Page Icon give it a name “My Daily Watch List”. Click Next
2.Select the Dashboard Layoutat the bottom click on “add”
3.Select Dashboard utilityand select "Multipage"
4.Click Next and enable ‘add the page to portal tabs’ and click Finish

5.Click on the edit button
6.Click on  and choose a folder or package with reports
7.See the output


Monday, December 14, 2009

How to use HTML tags to improve your reports?


HTML tags can deliver a lot of content without reducing performance of your reports.

For example: Use HTML tags to provide mouse over features on prompts, column labels etc.


Monday, December 7, 2009

How to organize information in multiple fields into one column such as addresses or name-invoice numbers etc?

IBM Cognos Report studio allows you to organize related content into a single column.


For example in the image below we have organized the employee information into a single column.

Steps to do this:

1. Add the required field to the List Object
2. Click on the "LOCK" icon to unlock the column
3.Add the other related fields

Tuesday, December 1, 2009

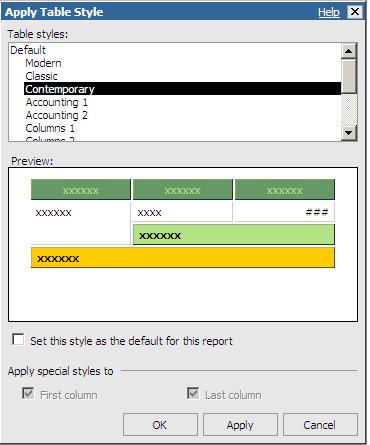
How to quickly create professional looking report formats and styles?

IBM Cognos Report Studio provides various Table styles to meet the needs of financial, budgeting, accounting and other reports.


Wednesday, November 25, 2009

Microcharts - The new visualization technique! in IBM Cognos 8.4

Micro charts can be inserted into rows of a report to improve visualization.


Thursday, September 24, 2009

Free Online Training in IBM Cognos 8 PowerPlay


Free Online training in IBM Cognos 8 PowerPlay
Hello Everyone,
We are pleased to announce a FREE online training in IBM Cognos 8 PowerPlay.
IBM Cognos 8 BI PowerPlay Studio: Web Exploration (V8.4) is designed to to view, explore, format and distribute PowerPlay reports using PowerPlay Studio.
Register now!

Introduction to IBM Cognos 8
PowerPlay Studio

  • Examine PowerPlay Studio and its interface
  • Add and save data to ad hoc reports
  • Drill Up and Drill down your Analysis
  • Filter and sort your reports
  • Create Arithmetic and Percent calculations
  • Identify Top 10 performers
  • Highlight exceptional data
  • Create Custom subsets to meet unique business requirements
  • View data by using appropriate charts

Save up to 25% on your next IBM software purchase or IBM training classes. Please call Sandra at 404.315.1555, x 314 or email us
Please mark your calendars for October 16th 2009 between 10:00-11:00 AM EST. Please email support@softpath.net to confirm your seat and receive a copy of the training documentation.

Monday, September 21, 2009

Migration Step by Step tasks

This is a tentative migration road map. All durations and sub tasks are estimates, more duration is required for Planning. All assumption are based on WINDOWS machines.


Activity Sub task Duration Res
Sandbox migration
Install series 7 1 day 1
Instal Cognos8 1 day 1
Configure LDAP/Access Manager 1 day 1
Import Sample Catalogs and Reports 0.5 day 1
Import Impromtu reports 0.5 day 1
Import Sample Cubes and reports 0.5 day 1
Migrate Catalog, IMPCAT2XML 0.5 day 1
Copy Unsecured cubes 0.25 days 1
Copy Secured Cubes 0.25 days 1
Publish a cube as a package 0.25 days 1
Create data source connection for catalog and cubes 0.25 days 1
Test them to see if they work 1 day 1
Use Migrate to C8 to migrate impromptu and PP reports 1 day 1
Use Deploment Manager to create a dmp file of web content such as newsboxes 1 day 1
Manually deploy reports to CC 1 day 1
Test your reports/open with AS/RS 1 day 1
11 days 1
Actual Migration 1
Pre Clean the environment 1
Remove broken url's 0.5 days 1
Remove unwanted reports 1 day 1
Identify secured and unsecured cubes 1 day 1
Create administrator as the owner for all catalogs and cubes 1 day 1
Identify any image files 0.5 days 1
4 days 1
Organize your source 1
Create a folder for Catalogs 0.25 days 1
Create a folder for Cubes 0.25 days 1
Create a folder for Impromptu reports 0.25 days 1
Use a deployment manager to create dmp files for web content 0.5 days 1
Create a folder for PPX reports 0.25 days 1
1.5 days 1
step by step Migration 1
CATALOG Migration 1
Migrate Catalogs using Impcat2 XML 1 day
Publish FM packages with Datasource connection 1 day 1
Test your migration extensively 3 days 1
5 days 1
CUBE and MDL Migration 1
FTP your MDL and Cubes 1 day
Edit the COGNOS.INI file for datasource connection 0.5 day 1
OPEN MDL in newer version of Transformer and save 1 day 1
Publish cubes using Transformer/FM 2 days 1
Create data source connections for cubes 1 day 1
Test your Cubes 2 days 1
6.5 days 1
Migrate to C8 1
Open CMD window 0.25 ays 1
Browse to the location 0.25 days 1
Type MigratetoC8 <source> <target> 0.25 days 1
Look at the target directories 1 day 1
Repeat the above 4 steps for various folders(IWR,IMR,PPX,DMP etc) 1 day 1
2.75 days 1
DeployToC8 1
Two Option-Manual or auto
Copy the .zip directory from target location to c8 deploment location 0.5 days 1
Check Migration service is on C8 ( defauly is always on) 0.5 day 1
Import the deployment file 0.25 days 1
Test your reports 2 days 1
AUTO(optionl) 1
Browse to location c8/deplotC8 0.25 days 1
Type DeploytoC8 <source><target> 1 day 1
Test your reports 2 days 1
5.75 days 1
Post Migration Tasks 1
Replace IQD's with package/report source 7 days 1
Disable/Interoperate series 7 and Cognos8 5 days 1
Recreate broken reports 10 days 1
22 days 1
Total duration (approx) 60 days 1


Wednesday, August 12, 2009

Migration: Best Practice to Replace IQD's

The first challenge in the post migration phase is to gradually reduce dependence on Impromptu Query Definitions (IQD) as a data source in Transformer.
The reasons for moving away from IQD’s are:
1. IQD’s are files and hence should be avoided
2. You might need to maintain Impromptu licenses
3. If you have created IQDs using Framework Manager then you still would be building cubes using an externalized file.

The IQD’s can be replaced using Report Studio Report or a Framework Manager Package. In both the cases the source has to be pre-validated to avoid cross joins and other resource intensive sql.

Using Report Studio Reports as source for Transformer Cubes
While working with RS reports, we should keep in mind that we should not use objects like crosstab, repeaters etc. We can only work with LIST type reports.
Pros:
-The report would have been tested and simplified.
-Any change or update to the query can be managed using Framework Manager or Report Studio.
-Complex Calculations can be performed

Cons:
- Transformer only picks the fields that are in the report layout and not all those in Query.
- If the query is not dedicated for transformer use then we could be querying unnecessary columns. Layout calculations and prompts would have to be modified
-Reports specifications have to be updated if we need to add new fields to the transformer model
-We would have to ungroup columns and any counts based on grouped values would be lost too
-If the Transformer is based on ( structured and Fact queries) we would have to create multiple queries


Relational Package as a source for Transformer Cubes:
Pros:
- Importing relational sources gives more flexibility to the transformer modeler.

Cons:
-If the package is not designed well and requires updates
- Cross joins could be executed, if for example a single package with multiple namespaces was published. We could be creating dimensions from completely different namespaces.

DMR Packages as source for Transformer Cubes:
Pros:
- DMR packages offer visibility and predictability
- Developers can import dimensions from DMR package directly into the Transformer dimension map area.
-This make sure that dimension structure is standardized across the company

Cons:
-If a particular Transformer model requires a different hierarchy then we will have to maintain multiple versions of the dimension in FM
-We have to make sure Measures are allocated to all the lowest levels in all dimensions
-It takes more modeling resource/time as we have to generate dimensions and star groupings from Relational schemas.

Thursday, July 23, 2009

Free End User Training - Cognos Query Studio

We are pleased to announce a FREE online training in Cognos Query Studio.Query studio is a Cognos tool that can whip up adhoc reports and analysis for users by users.

Introduction to Query Studio
Examine Query Studio and its interface
Add and save data to ad hoc reports
View data by using appropriate charts
Create list, grouped list, and crosstab reports
Filter and sort your reports
Create detail and summary calculations
Move columns and reorder columns
New features in Cognos8.4 Query Studio
Best Practices and optimization of queries

Please mark your calendars for August 21st 2009 between 10:00-11:00 AM. Please email support@softpath.net to confirm your seat and receive a copy of the training documentation.

Wednesday, July 15, 2009

Pointers while Integrating/migrating- M&A scenario

Here are some general pointers to be kept in mind, while planning migrations, upgrades, conversions and the likes. Most of these recommendations can be made only after a thorough understanding of client systems architecture, maturity of their BI systems and their future plans. Anyways here is an appetizer.

1. Assess your architecture
2. Huge performance gains can be achieved by having dedicated servers for reporting services, batch report services, Agent and monitoring services and presentation services respectively.
3. Gateways
ISAPI is most recommended gateway. Also improve performance by adding multiple gateways.
Especially, if you have multiple locations for your servers
4. Perform Capacity Planning Exercise. Most BI tools offer pre built exercises.
5. If switching Security namespaces, you will encounter a lot of accessibility issues and will not be able to export personal content
6. If you have external vendors/clients accessing your BI portal the firewalls can cause accessibility issues. You will have to configure your firewalls and gateways to support multiple dispatchers.
7. Consider virtualization of your servers to cut costs
8. If in the near future, you plan on merging data sources multiple companies, you might have to plan back up of existing Models, packages and data source connections. Also, perform a step by step deployment into new environments or domains.

Some Challenges you might come across are:

1. Accessing cross company portals. Are you going to have 2 portals? Are you going to add users in two domains?
2. If development and support teams are in Domain A and have to support users in domain B. Developers and support Team, ticket management has to work across domains with additional privileges. This might not seem like huge liability but it can be time consuming to get it up and running
3. There will be a need for more licenses and appropriate capabilities
4. You will have to assess he hardware requirements and configuration

However, this is a very good time and opportunity to introduce new BI technologies and practices.
- You could start a BICC ( BI Competency Center)
- Upgrade to newer versions of the tools

Tuesday, June 16, 2009

Master Data Management

Authored by:Chintan

What is Master Data? Most of the IT organizations have their data dispersed and stored at various locations. But the data is shared and used by several of the applications that make up a data warehouse. For example, an ERP system has data from Customer Master, Item Master and Account Master. The master data is one of the key assets of any company.

Need of Master Data Management: Since master data is used by multiple applications, an error in master data can cause errors in all the applications that use it. For example, all important documents, bills, checks are sent to the wrong person because of an incorrect address in Customer Master. Similarly, an incorrect price in Item Master can be a marketing disaster for an organization. An incorrect account number in an Account Master can lead to huge fines. To overcome such hazards, maintaining high quality and consistent set of master data is necessary for all organizations.

What is Master Data Management (MDM)? The technology, tools and processes required to create and maintain consistent and accurate lists of master data is known as Master Data Management. MDM is a continuous, iterative process. There are many factors considered for MDM which involves requirements, priorities, resource availability, time frame and the size of the problem.

MDM Life Cycle: MDM project involves many stages as follows:
1- Identify sources of master data.
2- Identify the producers and consumers of the master data.
3- Collect and analyze metadata about master data.
4- Appoint data stewards.
5- Develop the master-data model.
6- Choose a toolset.
7- Finalize and receive approval for the process.
8- Design and implement the process.
9- Test the master data.
10- Modify the producing and consuming systems.
11- Implement the maintenance processes.

Conclusion: In recent times, creating and maintaining accurate and complete master data has become a business imperative. Both large and small businesses must develop data maintenance and governance processes and procedures, to obtain and maintain accurate master data.